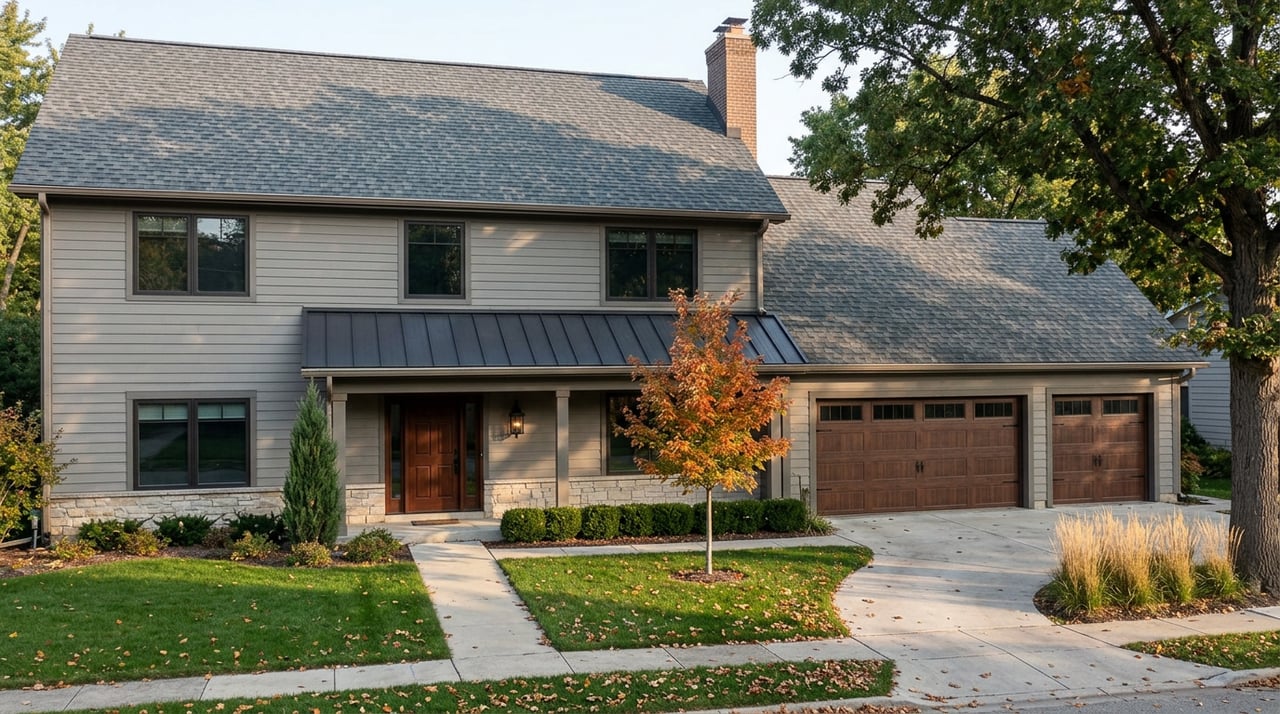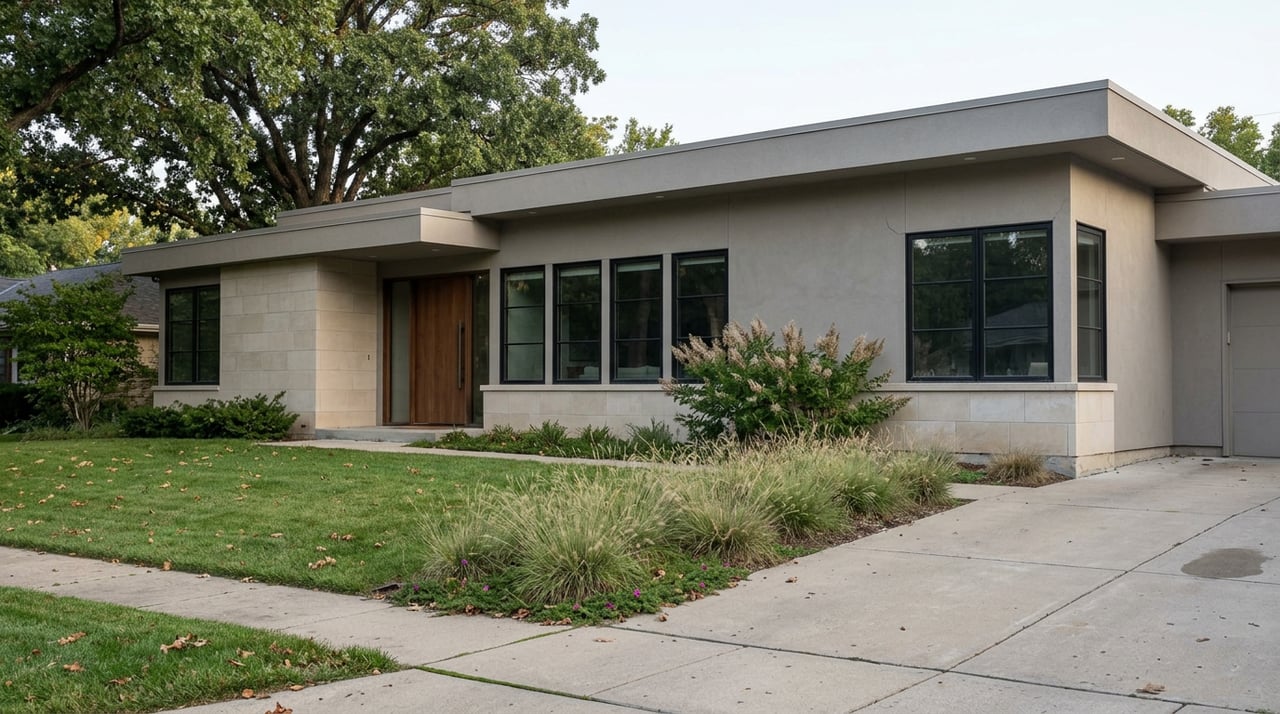
Denver does not have a selling season. It has several, running at different speeds, and the one you are standing in has less to do with the month than with your price band and your zip code.
Every August the same question surfaces in Denver kitchens, usually phrased as if the answer were obvious. Did we miss the window. It gets asked in Park Hill and in Berkeley and in Green Valley Ranch, and it almost always carries an assumption underneath it: that there is one window, that it opens in April, and that it closed sometime around the Fourth of July.
The July data says something more useful than that. The market did slow. It slowed in a very specific way, and one segment of it did not slow at all. Knowing which of those descriptions applies to your house is worth more than any general read on the season.
What actually slowed in July
Denver Metro recorded 3,667 closed sales in July, down 11.81 percent from June and 5.68 percent from July of last year. New listings fell too, down 5.32 percent from June to 5,447. Both sides of the market stepped back at the same time.
That detail matters more than the headline number. When buyers retreat and sellers hold, price gives way. When both retreat together, the market gets quieter without getting cheaper. July was the second version. The median close price landed at $605,000, down 1.54 percent from June but up 2.95 percent from a year ago, and sellers still averaged 99 percent of list.
3,667Closed sales in July | $605,000Median close price | 21Median days on market |
Source: DMAR Market Trends Report, July 2026 data, sourced from REcolorado
Slower is not the same as weaker. Volume dropped by double digits while price held within two percent of June and finished the month ahead of last July. Those are two different stories, and most coverage only tells the first one.
The inventory number that reframes the conversation
Active listings finished July at 13,115, up 2.91 percent from June and still 6.29 percent below where they sat a year ago. Measured against 2021, that feels like a flood. Measured against the longer record, it is not. The chair of DMAR's Market Trends Committee made the point directly, noting that this market routinely carried more than 20,000 active listings between 2008 and 2012, and that Denver today is no longer scarce rather than oversupplied.
Homes are also taking a little longer to sell than they did in June, at 21 days against 18, while still moving faster than the 24 days they took last July. Two different comparisons, two different feelings, one set of numbers.
Most sellers are not competing against more inventory. They are competing against a memory of 2021.
The segment that ignored the calendar entirely
While the broad market followed the seasonal script, the top of the market did not. Through July, 3,569 properties priced at $1 million and above sold across the metro for a combined $5.83 billion. Those homes spent a median of 17 days on the market, four days faster than the metro overall, at a median of $572 per square foot.
The attached side of that segment was the outlier of the year. Luxury condo and townhome sales rose 26.09 percent from June and 81.25 percent from a year earlier. That is not a seasonal pattern. That is a different buyer operating on a different clock.
Seasonality is a price band question
Three curves run through this market at the same time, and they do not move together.
The family curve
The broad detached market moves with school calendars, summer breaks, and the logistics of relocating a household. This is where real seasonality lives, and it is the curve most people are describing when they say the market slows in August. If your home sits in the meat of the metro price range, this curve is yours.
The liquidity curve
At $1 million and above, timing is driven by liquidity events, compensation cycles, relocation packages, and tax planning. Those things do not care what month it is. The July numbers are the evidence, not the theory.
The attached curve
Condos and townhomes carry longer marketing times and deeper supply, with a median of 40 days on market in July. Their seasonality is muted because the buyer is generally less bound to a school calendar in the first place. Slower here is structural, not seasonal, and it responds to price and presentation rather than to the month.
What this means if you are standing on two curves at once
A homeowner in Park Hill, Central Park, Berkeley, Sloan's Lake, Sunnyside, or Green Valley Ranch who is thinking about Hilltop, Wash Park, or Cherry Creek is not asking one seasonality question. They are asking two. They are selling into the family curve and buying into the liquidity curve, and those two curves are behaving differently right now.
That spread is the entire decision. A seller who waits for spring on the sell side is also waiting on the buy side, into a segment that has shown no sign of pausing and has been absorbing inventory faster than the market around it. The cost of waiting is rarely just a slower August. It is nine months of movement in the market you intend to enter.
- Pull your own submarket numbers before you decide. The metro median is a headline, not your house.
- Identify which curve your price band actually sits on, then stop applying the other one to your timeline.
- If you are selling one property and buying another, model both sides. The gap between them matters more than either number alone.
- If the answer is to wait, put a number on what waiting costs. A decision to wait is still a decision.
Most of that analysis takes a single conversation and a look at real submarket data rather than a metro average. If you want to see what the two curves look like against your specific address and your intended next one, that is a conversation worth having before the fall.
The Strategic Takeaway
The calendar does not price your house. Your price band and your submarket do.
Seasonality is real, but it is not universal, and treating it as one curve is how good decisions get postponed for bad reasons. The month is the least specific input available to you, and it is the one most people weight the heaviest.
Ownership decisions compound. A nine month delay is not a pause, it is a position, and it should be taken deliberately or not at all.
| Chad J. Nash, Ph.D. Strategic Real Estate Advisor · Coldwell Banker Global Luxury Luxury at Every Level |